Median U.S. New-House Price History
Facts verified: against 3 source-tracked canonical facts in the PennyCalc registry; page sources include Census/HUD Quarterly Sales Table Q6 for the current quarterly price snapshot
Reviewed by Josh for financial modeling and data. See more by Josh.
Every annual average of the Census median new-house sales price from 1963 through 2025, in the dollars of the day and in 2026 dollars, plus the separate 2026 Q2 median and an estimate of what it costs at the current weekly mortgage rate.
Sources: annual averages from Census/HUD median sales prices published as FRED series MSPUS; the latest quarterly observation from Census/HUD Quarterly Sales Table Q6; Freddie Mac Primary Mortgage Market Survey; BLS CPI-U. Latest price reading: 2026 Q2 at $410,700, rechecked 2026-08-30. Current rate quote: August 27, 2026 at 6.66%.
Pick a year. See what buyers faced.
Median price then
-
In 2026 dollars
-
Avg 30-yr rate
-
P&I, 2026 dollars
-
P&I assumes 20% down, 30-year fixed at that year's Freddie Mac annual average. Rates begin in 1972. Current comparison: the 2026 Q2 median of $410,700 at the August 27, 2026 weekly rate of 6.66% is $2,111/mo.
Nominal vs. real: two very different stories
The nominal line is a 23x moonshot. Deflate by CPI and the real line shows something closer to 2.1x since 1963 - with two decades (1979-1997) where real prices went nowhere, and a 2006 peak that took 15 years to durably reclaim.
Swipe sideways to read the full timeline. The year-by-year table below contains the same values.
What the annual median new house cost per month, 1972-2025
Price charts miss what buyers actually pay: the monthly note. Joining the Census median new-house sale price with each year's Freddie Mac average rate (20% down, 30-year fixed) and converting to 2026 dollars produces the series below - and its verdict is not the one the nostalgia says.
Swipe sideways to compare monthly costs by year. The year-by-year table below contains the same values.
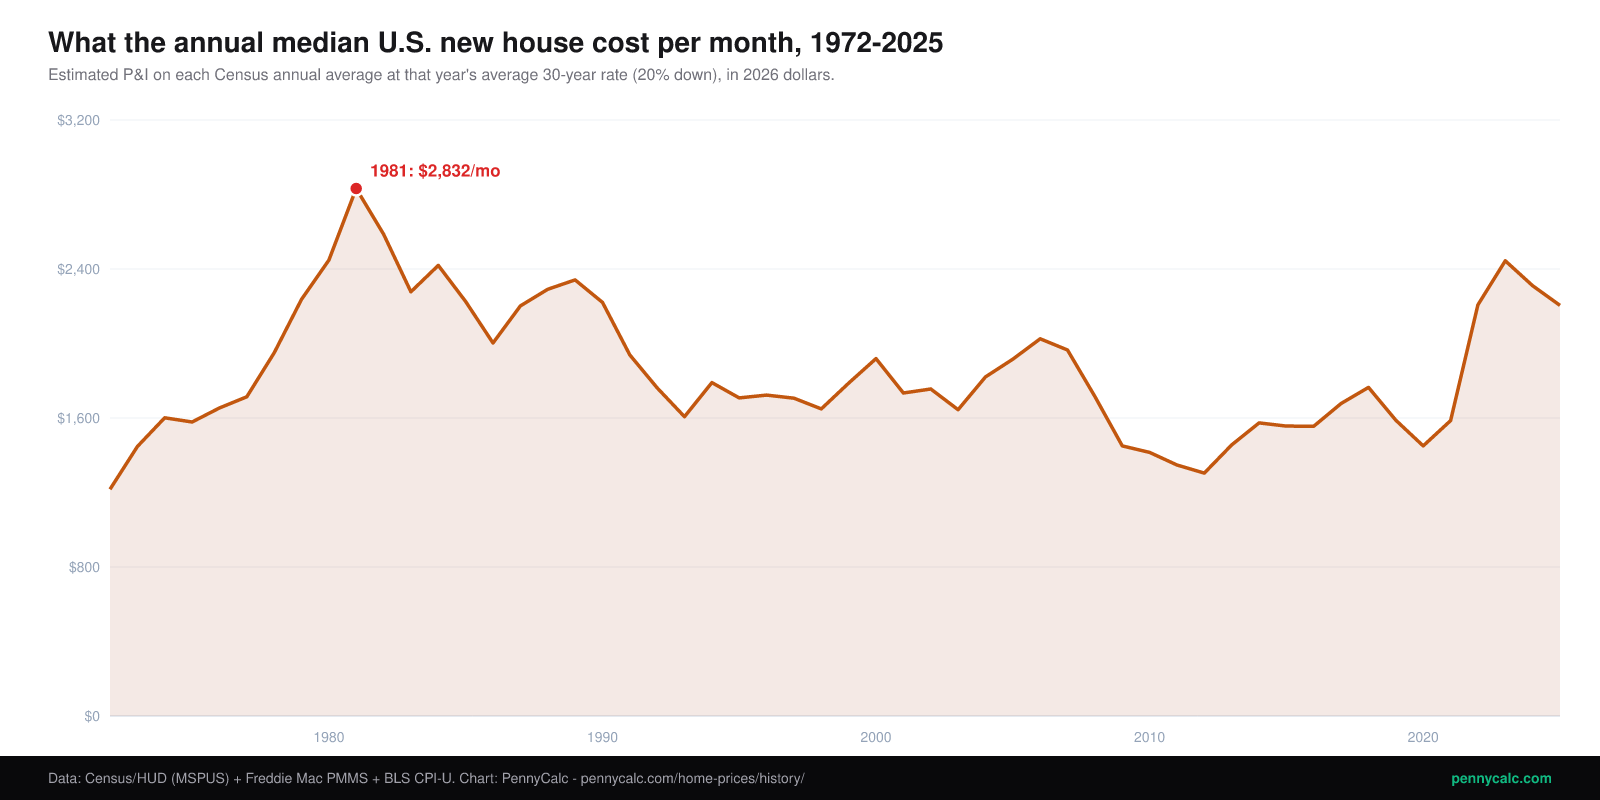
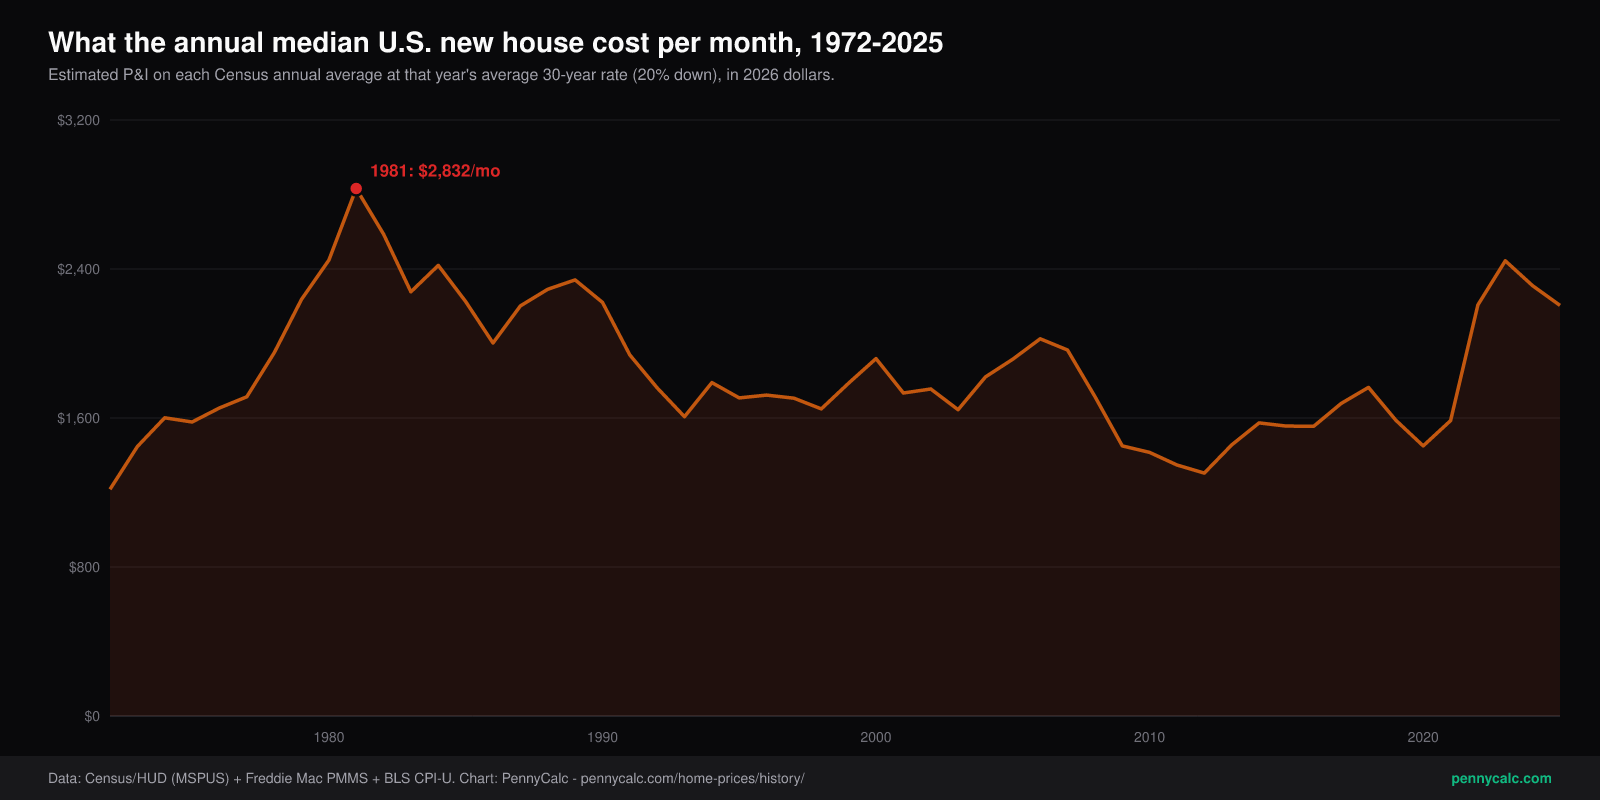
The highest real monthly payment in the annual-history comparison is not 2022 - it is 1981, when a $68,950 median new house at 16.63% cost $770 a month, which is $2,832 in 2026 dollars. The 2026 Q2 median at the August 27, 2026 weekly rate of 6.66% runs $2,111. The early-1980s buyer faced a harder monthly note than the current comparison, in exchange for a far cheaper house to refinance later - which is exactly what that generation did as rates fell for 40 years.
The cheapest sustained window was 1972 ($1,217/mo in today's money): post-crash prices with post-crisis rates. Buyers who cleared 2012's tight credit screens got the best price-times-rate deal in a half century of data. The honest caveat: this series excludes existing-home sales, income, taxes, and insurance, and the median new house itself grew from roughly 1,500 to 2,300 square feet over the period - the 1975 median and current median are not the same house.
Things you might not know
- Real prices went nowhere for 18 years. In 2026 dollars, the 1979 median was not durably exceeded until 1997. An entire housing generation experienced homes as an inflation hedge, not a growth asset.
- 1981 beat 2022 on monthly pain. The 16.63% rate year produced the most expensive real monthly payment in the series ($2,832), despite a median price of $68,950. Rates move payments more than prices do at the extremes.
- The 2012 window was the anomaly, not 2021. The cheapest real payment in a half century ($1,217/mo) came from crash prices meeting crisis rates. 2021's 2.96% rates were paired with already-elevated prices.
- The median new house doubled in size. Census characteristics data puts the median new home near 1,500 sq ft in the early 1970s and about 2,300 sq ft today, so a real "2.4x price" partly buys more house. Per square foot, the real increase is far smaller.
- Nominal prices almost never fall. Only 1970, 2007-2011, and 2023-2025 show nominal annual declines. The separate 2026 Q2 reading remains below the 2022 annual peak. Sellers withdraw rather than cut, which is why volume collapses before prices do.
Year-by-year table: median price, real price, rate, and monthly cost
| Year | Median price | In 2026 dollars | Avg 30-yr rate | Est. P&I (2026 $) |
|---|---|---|---|---|
| 1963 | $18,050 | $197,252 | - | - |
| 1964 | $18,925 | $204,146 | - | - |
| 1965 | $20,125 | $213,644 | - | - |
| 1966 | $21,500 | $221,218 | - | - |
| 1967 | $22,750 | $227,772 | - | - |
| 1968 | $24,800 | $238,308 | - | - |
| 1969 | $25,600 | $233,260 | - | - |
| 1970 | $23,475 | $202,321 | - | - |
| 1971 | $25,225 | $208,278 | - | - |
| 1972 | $27,525 | $220,200 | 7.38% | $1,217 |
| 1973 | $32,600 | $245,528 | 8.04% | $1,447 |
| 1974 | $36,050 | $244,526 | 9.19% | $1,601 |
| 1975 | $39,275 | $244,118 | 9.05% | $1,578 |
| 1976 | $44,225 | $259,909 | 8.87% | $1,654 |
| 1977 | $48,900 | $269,838 | 8.85% | $1,714 |
| 1978 | $55,850 | $286,445 | 9.64% | $1,950 |
| 1979 | $62,750 | $289,030 | 11.20% | $2,237 |
| 1980 | $64,750 | $262,772 | 13.74% | $2,448 |
| 1981 | $68,950 | $253,651 | 16.63% | $2,832 |
| 1982 | $69,225 | $239,884 | 16.04% | $2,587 |
| 1983 | $75,375 | $253,066 | 13.24% | $2,278 |
| 1984 | $79,950 | $257,317 | 13.88% | $2,420 |
| 1985 | $84,275 | $261,910 | 12.43% | $2,225 |
| 1986 | $92,025 | $280,777 | 10.19% | $2,003 |
| 1987 | $104,700 | $308,201 | 10.21% | $2,202 |
| 1988 | $112,225 | $317,228 | 10.34% | $2,291 |
| 1989 | $120,425 | $324,759 | 10.32% | $2,342 |
| 1990 | $122,300 | $312,908 | 10.13% | $2,221 |
| 1991 | $119,975 | $294,564 | 9.25% | $1,939 |
| 1992 | $121,375 | $289,293 | 8.39% | $1,762 |
| 1993 | $126,500 | $292,745 | 7.31% | $1,607 |
| 1994 | $130,425 | $294,292 | 8.38% | $1,790 |
| 1995 | $133,475 | $292,874 | 7.93% | $1,708 |
| 1996 | $140,250 | $298,914 | 7.81% | $1,723 |
| 1997 | $145,000 | $302,106 | 7.60% | $1,706 |
| 1998 | $151,925 | $311,679 | 6.94% | $1,649 |
| 1999 | $160,125 | $321,403 | 7.44% | $1,787 |
| 2000 | $167,550 | $325,370 | 8.05% | $1,919 |
| 2001 | $173,100 | $326,847 | 6.97% | $1,734 |
| 2002 | $186,025 | $345,785 | 6.54% | $1,756 |
| 2003 | $192,125 | $349,166 | 5.83% | $1,644 |
| 2004 | $218,150 | $386,180 | 5.84% | $1,821 |
| 2005 | $236,550 | $405,030 | 5.87% | $1,916 |
| 2006 | $243,750 | $404,315 | 6.41% | $2,025 |
| 2007 | $244,950 | $395,134 | 6.34% | $1,965 |
| 2008 | $229,550 | $356,533 | 6.03% | $1,716 |
| 2009 | $215,650 | $336,193 | 5.04% | $1,450 |
| 2010 | $222,700 | $341,453 | 4.69% | $1,415 |
| 2011 | $224,900 | $334,400 | 4.45% | $1,348 |
| 2012 | $244,400 | $355,955 | 3.66% | $1,304 |
| 2013 | $266,225 | $382,084 | 3.98% | $1,456 |
| 2014 | $285,775 | $403,731 | 4.17% | $1,574 |
| 2015 | $294,150 | $415,037 | 3.85% | $1,557 |
| 2016 | $305,125 | $425,141 | 3.65% | $1,556 |
| 2017 | $322,425 | $439,898 | 3.99% | $1,678 |
| 2018 | $325,275 | $433,182 | 4.54% | $1,764 |
| 2019 | $320,250 | $418,817 | 3.94% | $1,588 |
| 2020 | $328,150 | $424,008 | 3.11% | $1,450 |
| 2021 | $383,000 | $472,602 | 2.96% | $1,586 |
| 2022 | $432,950 | $494,631 | 5.34% | $2,207 |
| 2023 | $426,525 | $468,100 | 6.81% | $2,444 |
| 2024 | $418,975 | $446,622 | 6.72% | $2,310 |
| 2025 | $415,400 | $431,531 | 6.60% | $2,205 |
Annual table sources: Census/HUD (FRED MSPUS), Freddie Mac PMMS annual averages, and BLS CPI-U. P&I assumes 20% down, 30-year fixed. The separate 2026 Q2 price is $410,700; it is not an annual-average row.
Frequently Asked Questions
What was the median new-house price in 1970, 1980, 1990, and 2000?
Is this the same as the Case-Shiller index?
Has the national median new-house price ever fallen?
Why compare monthly payments instead of prices?
What data would make this picture complete?
Related Calculators
Mortgage Calculator
Run the current median at any rate with full PITI.
Home Affordability Calculator
Your income against today's prices and rates.
Mortgage Rate History
The other half of the payment math, 1972-2026.
Inflation History
The CPI series behind every real-dollar figure here.
State Tax & Housing Comparison
Where the total cost of owning is highest and lowest.
S&P 500 Time Machine
How houses compare to stocks over the same decades.